Beam arrangements
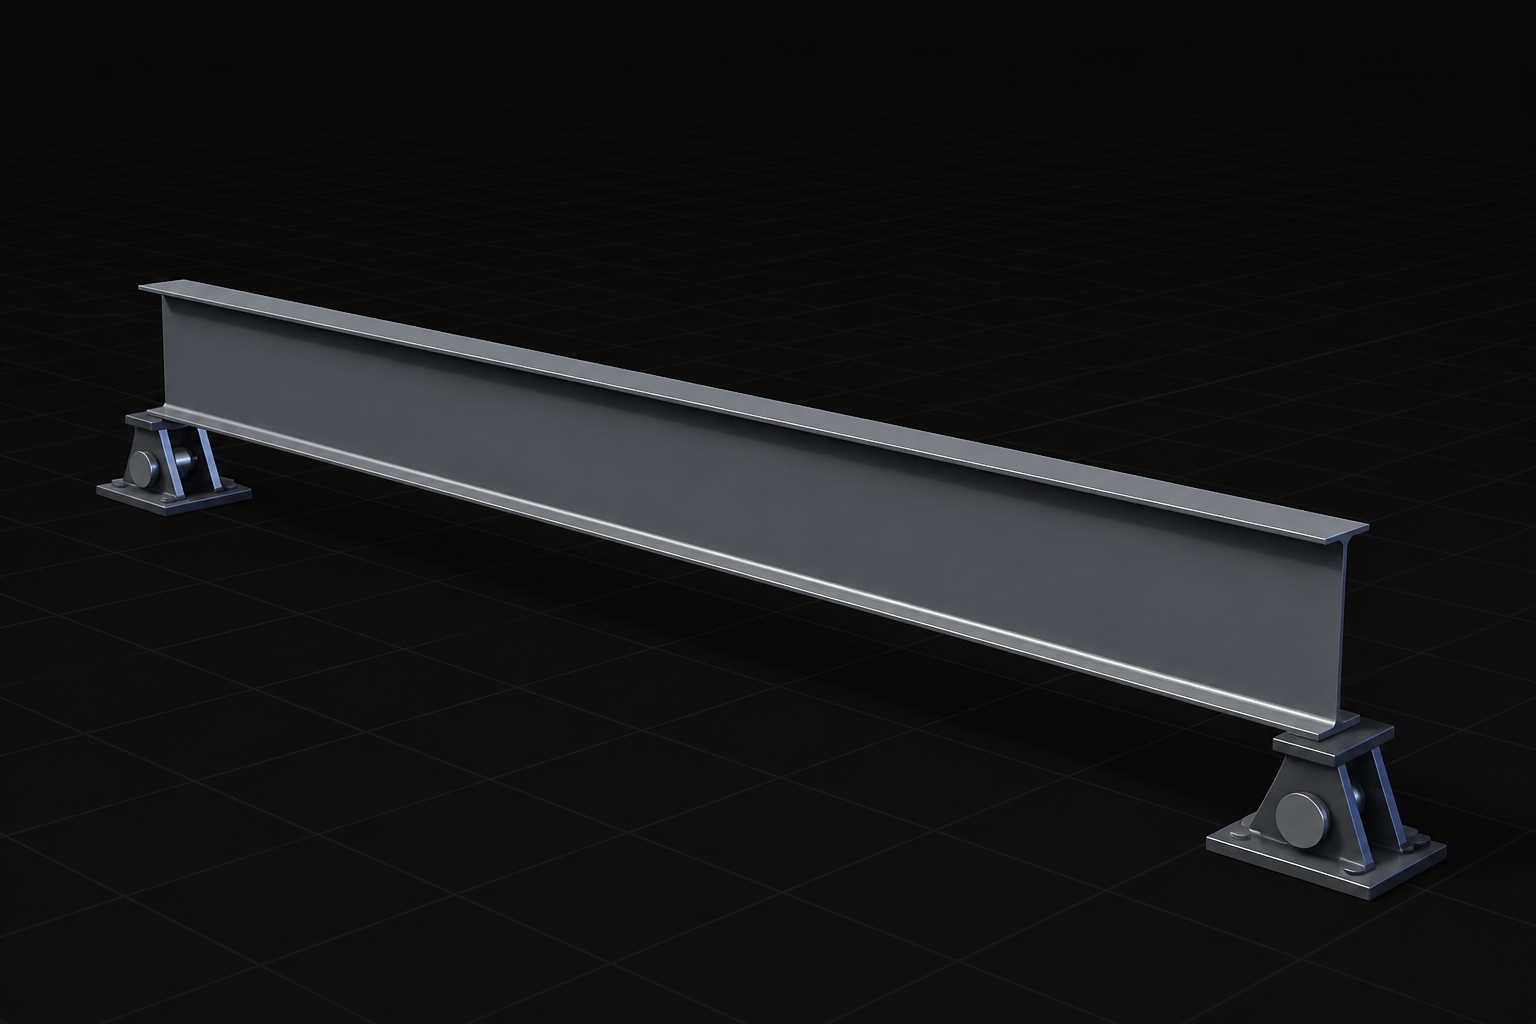
Model single-span, continuous, cantilever, and overhanging beams with multiple, editable supports.
ALDERSON BEAMS
Check, size, and report steel beams across AISC 360 and CSA S16, with the full calculation behind every result.
Model single-span, continuous, cantilever, and overhanging beams with multiple, editable supports.
Enter actual support positions and bearing lengths so reactions and bearing checks reflect the real condition.
Place loads and objects with expressions like L/2 or 6 feet from right instead of raw coordinates.
Choose CISC, AISC, or office built-up sections and custom materials, with their source recorded.
Divide the beam into the actual stability segments used by the design check, not one global length.
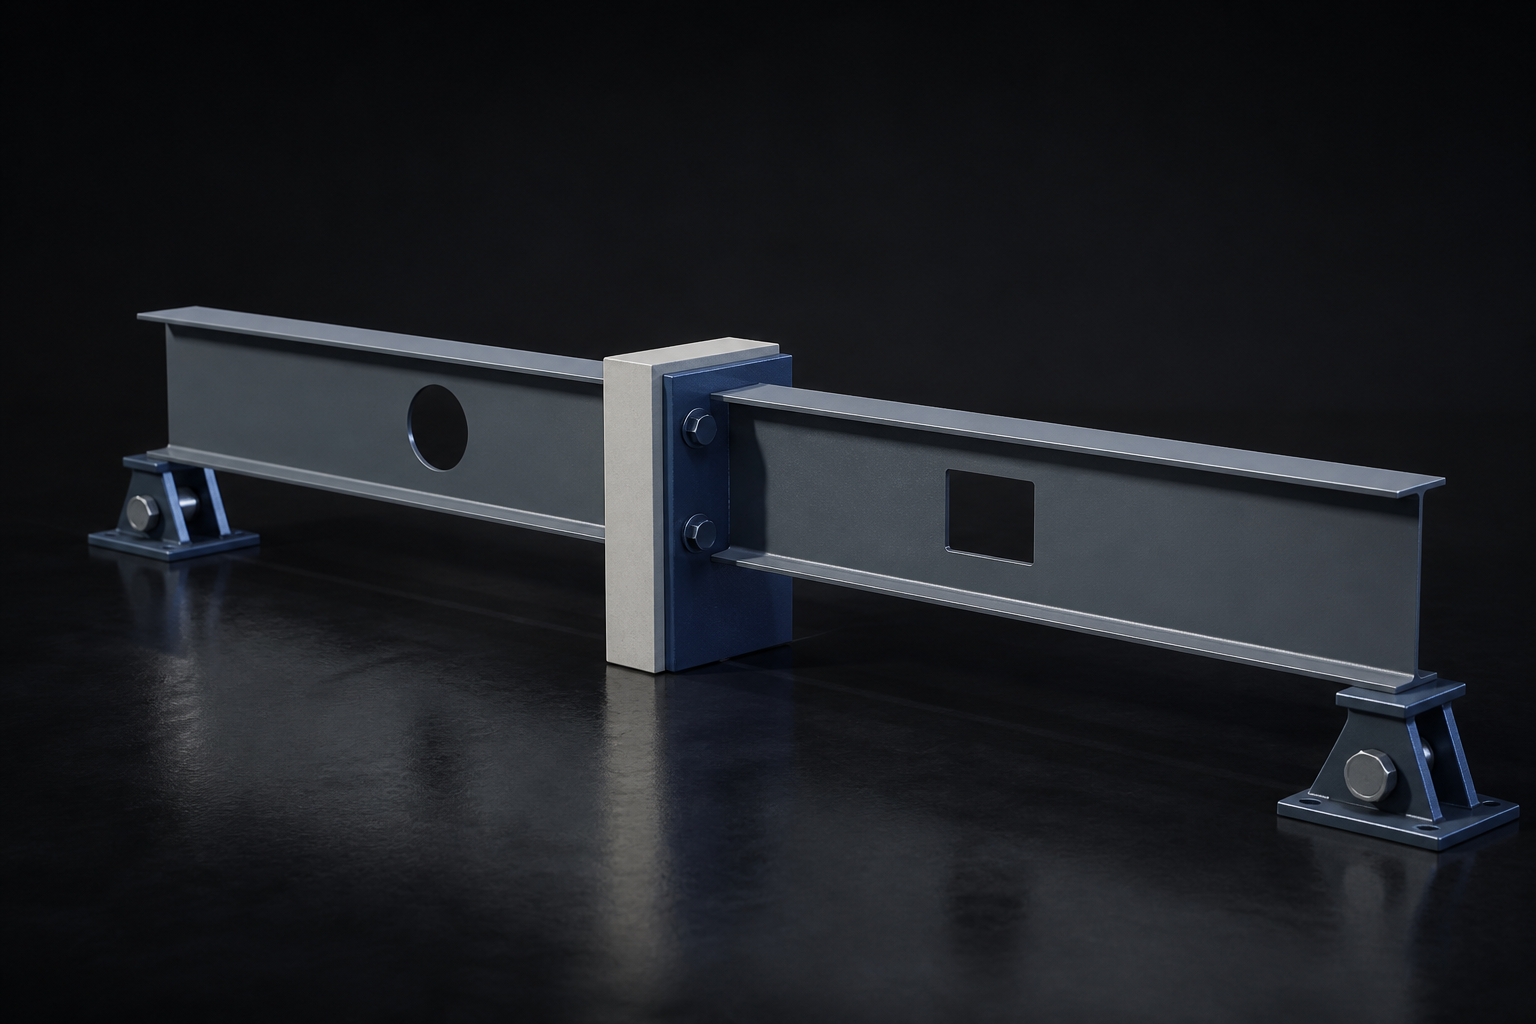
Declare top and bottom flange restraint independently for uplift, moment reversal, and changing compression zones.
Calculate Cb for every unbraced segment and retain the basis with the result.
See the controlling segment, location, and load case together.
Enter distributed, point, moment, and area loads, including tapered and joist-reaction loads.
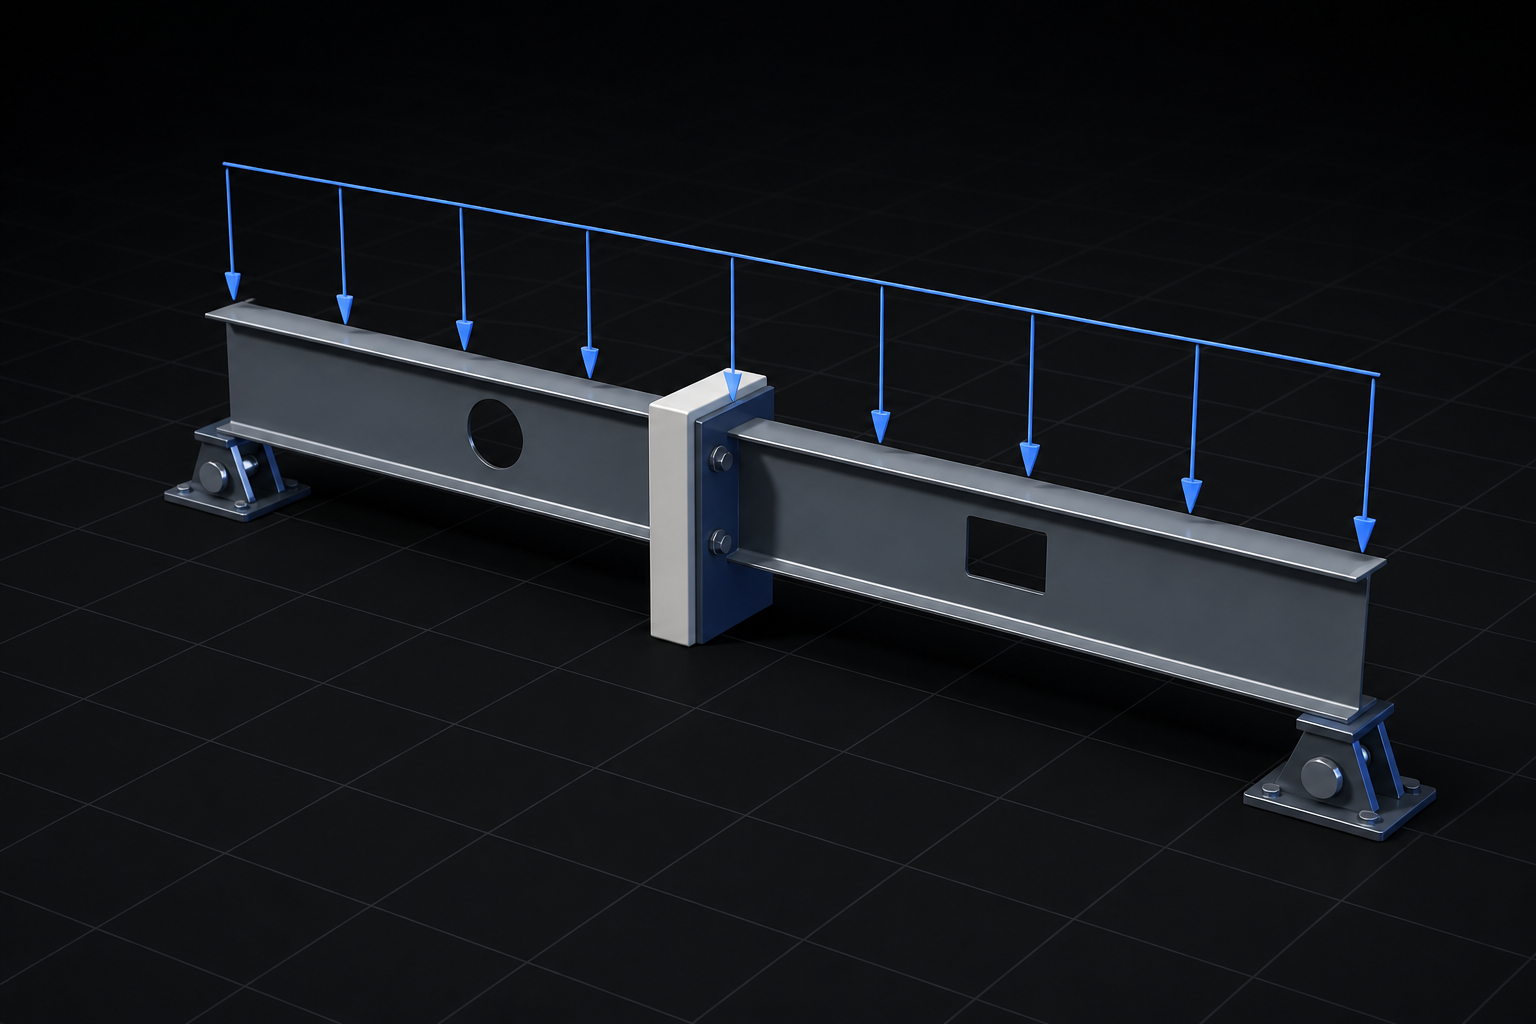
Keep dead, live, snow, wind, and seismic loads distinct through calculation and reporting.
Apply loads before or after composite action, with sustained percentages for long-term response.
Generate ASCE 7-22 or NBC 2020 combinations, or define your own, with a full derivation record.
Use a finalized support reaction in another beam without re-entering the value or losing its calculation lineage.
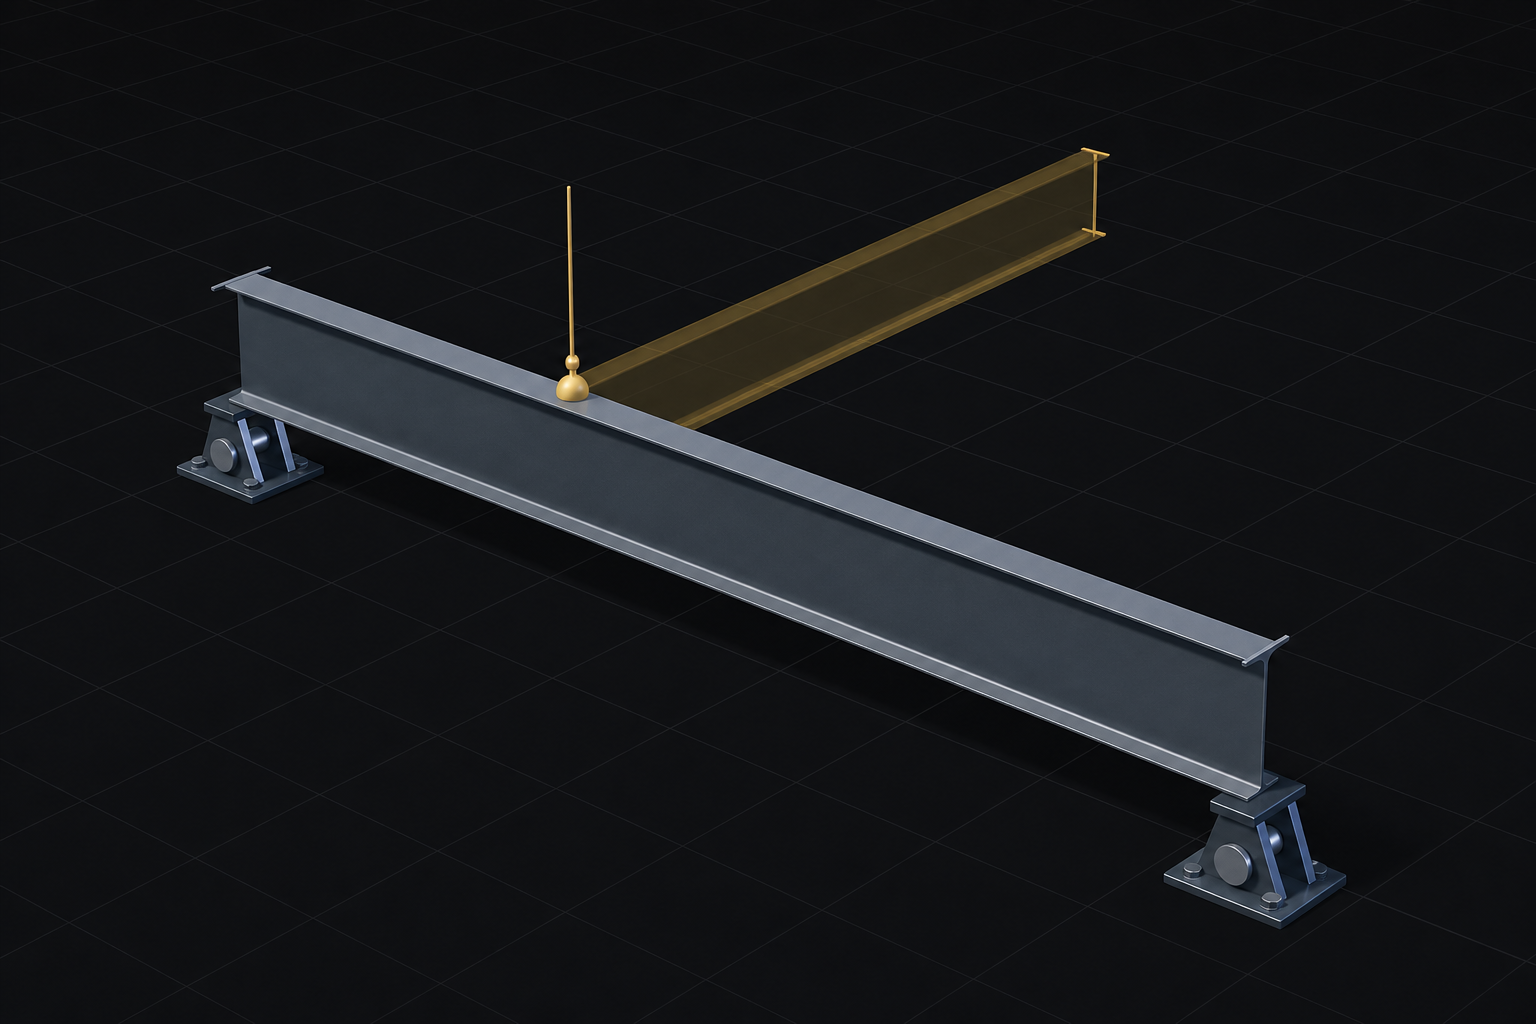
Know immediately when an upstream beam has changed and a linked reaction needs recalculating.
Circular dependencies are blocked, and beams supplying active reactions cannot be archived unsafely.
Calculate reactions, shear, moment, and deflection in one pass.
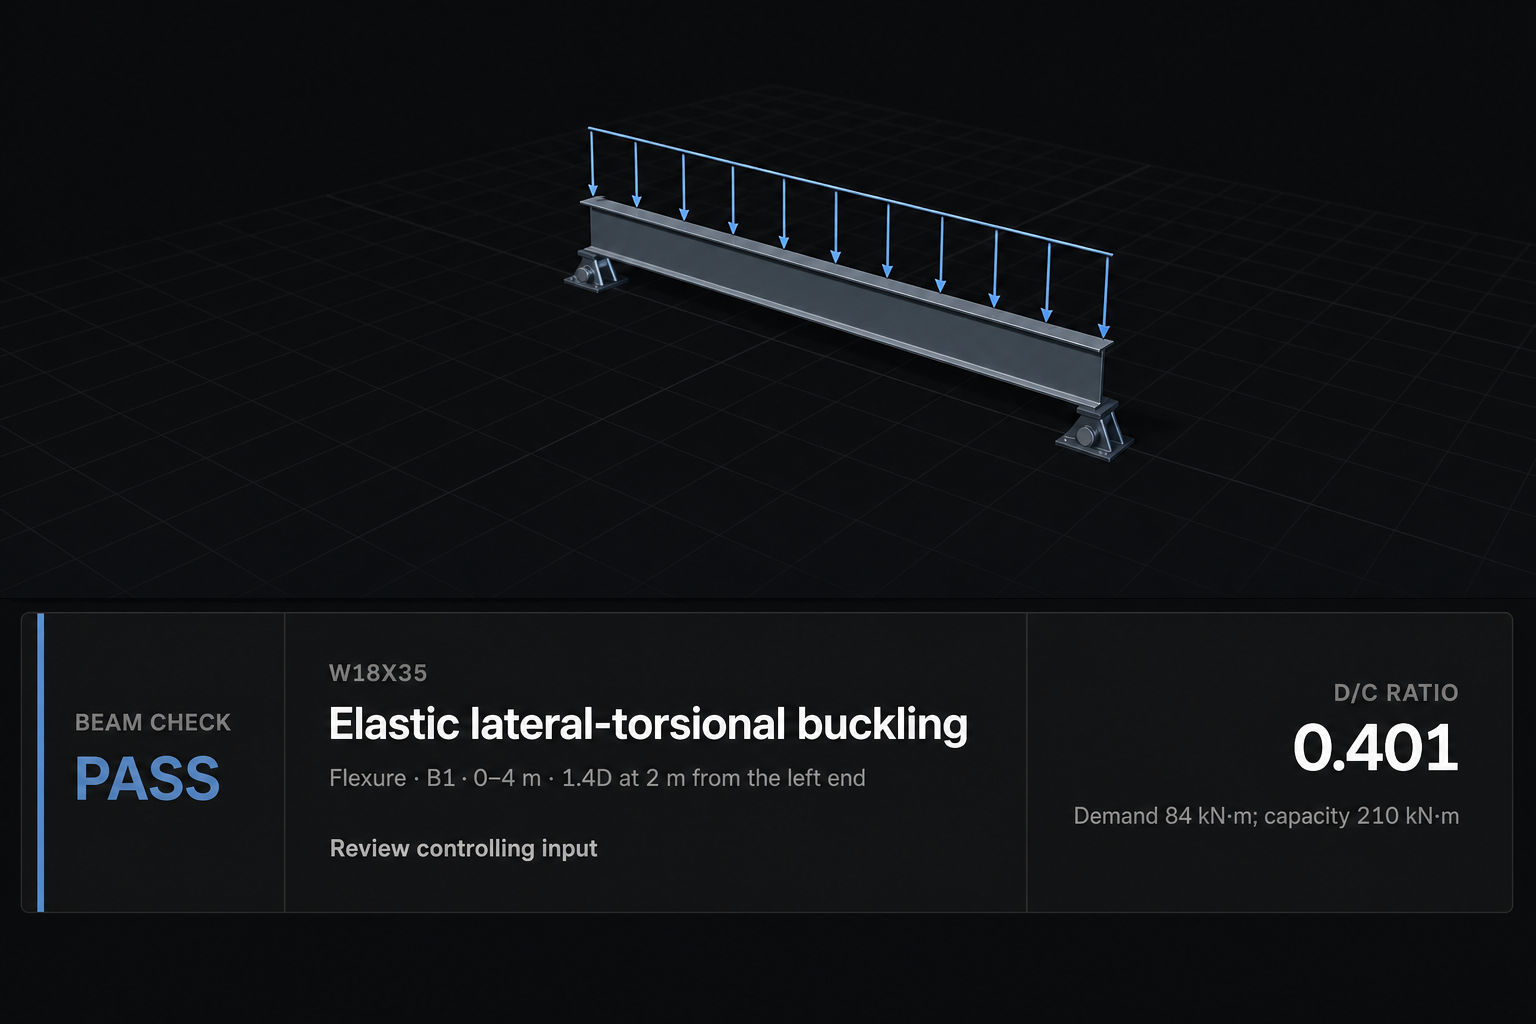
Inspect positive and negative envelopes with the governing combination and exact location.
Represent changing stiffness across construction stages instead of only the final condition.
Get an explicit failure when a model is unstable or outside supported scope.
Check flexure, lateral-torsional buckling, shear, and shear-moment interaction on the installed Canadian design path.
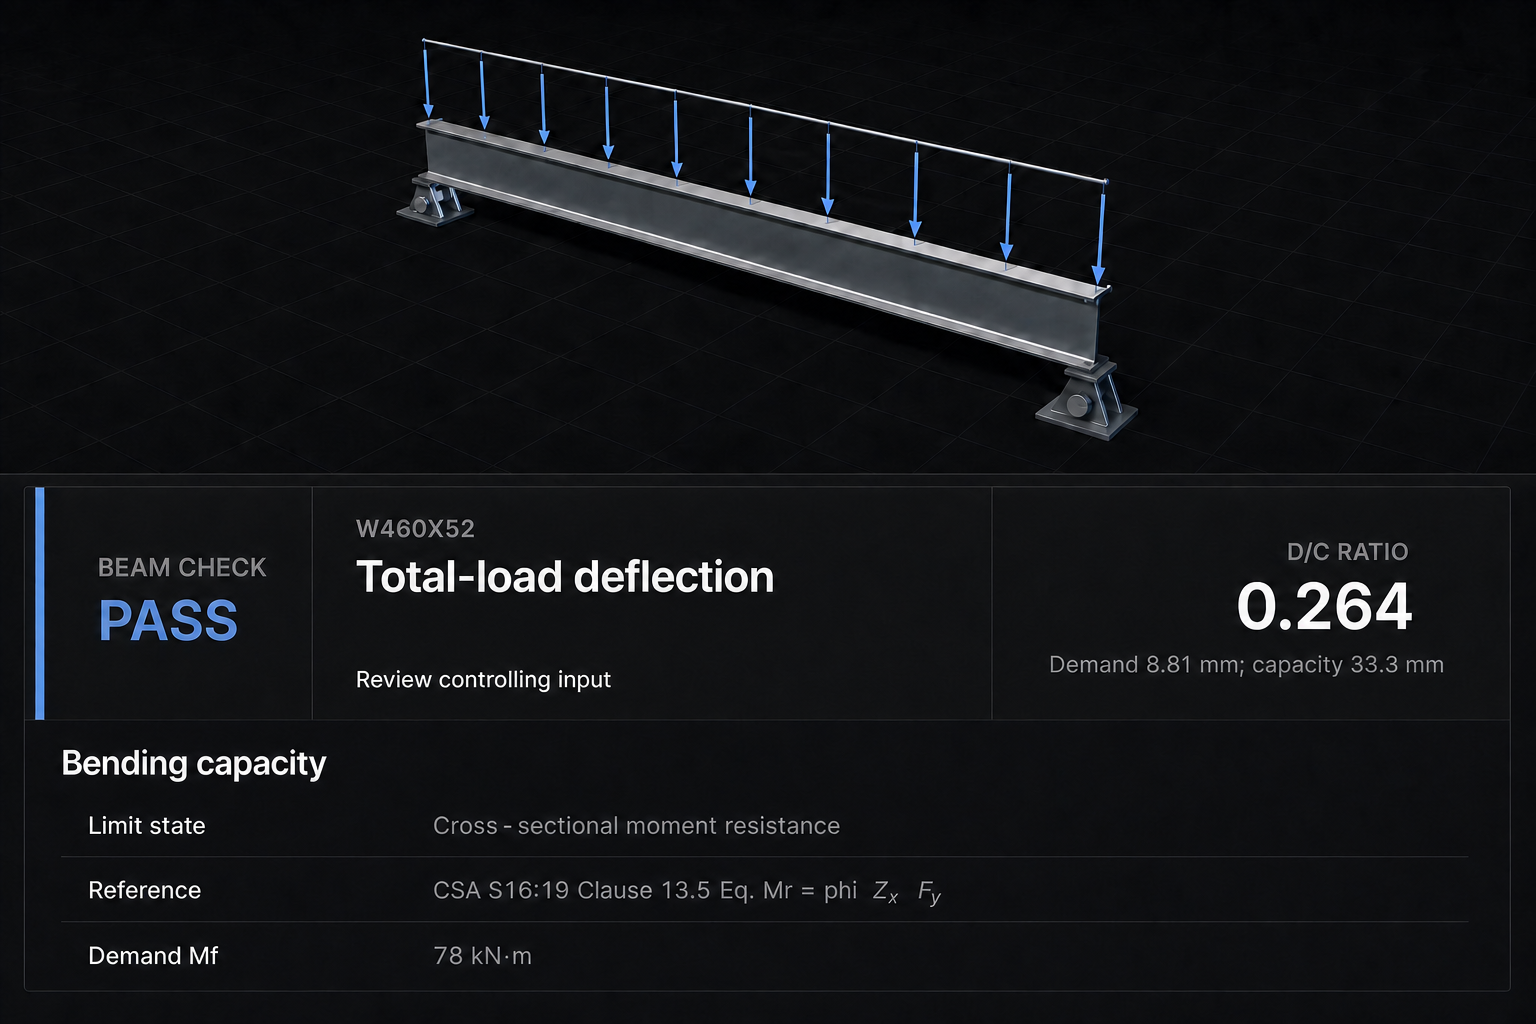
Check web and bearing limit states, with automatic stiffener recovery where supported.
Search CISC sections using the same checker that verifies your final design.
See the CISC dataset identity behind every property used in the calculation.
Check yielding, lateral-torsional buckling, and flange or web local buckling, including supported noncompact and slender-web cases.
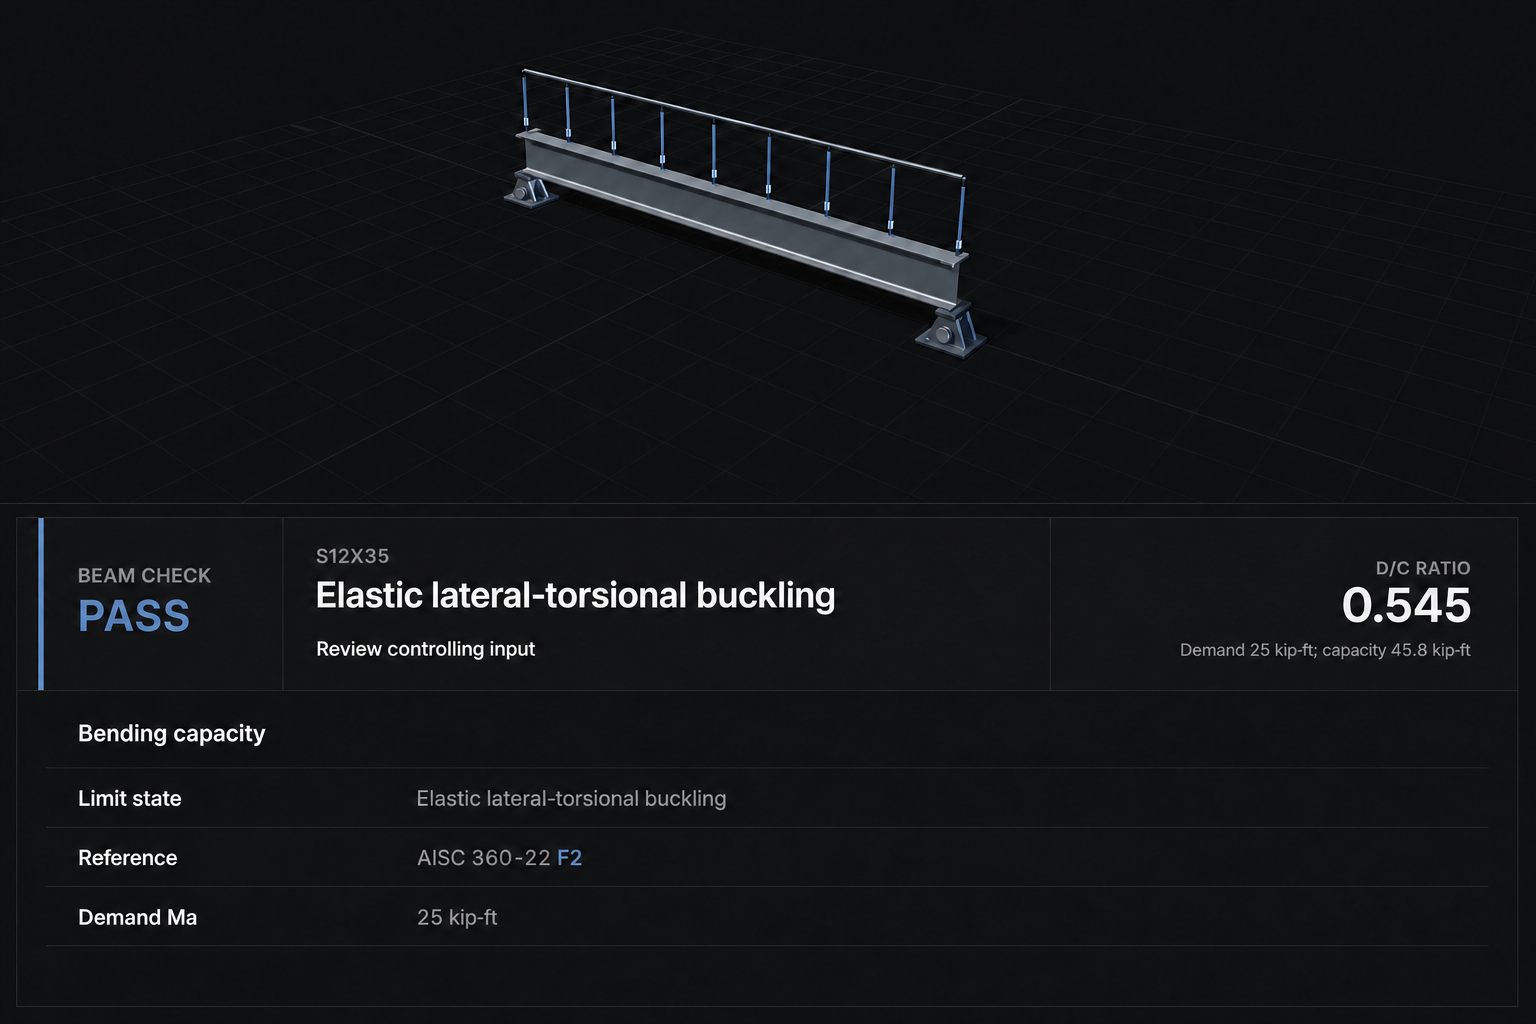
Check web shear and combined shear-moment response together.
Check web local yielding and web crippling where they apply.
Check deflection alongside wind uplift and moment reversal in one pass.
Use CSA, AISC LRFD, or AISC ASD composite design matched to your project standard.
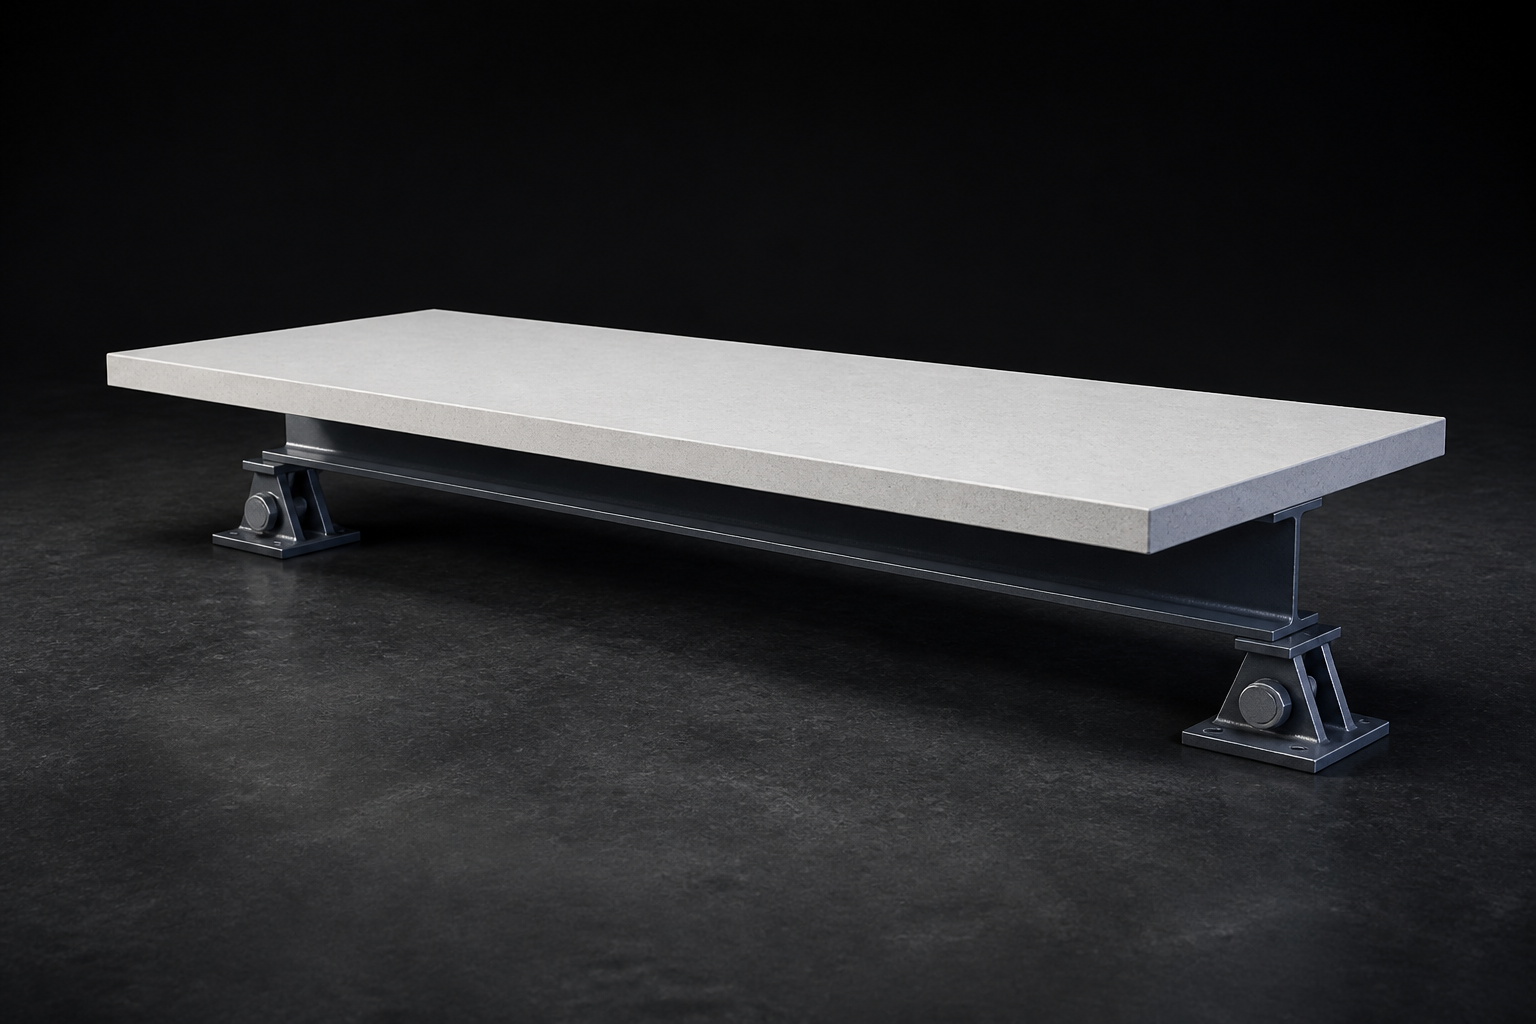
Model solid slabs, supported deck profiles, and asymmetric spacing or slab edges.
Set stud count and spacing yourself, or let Beams optimize for the credited composite action.
Check shored or unshored construction, camber, creep, and shrinkage in one workflow.
Place circular, rectangular, square, and obround openings individually or in a series.
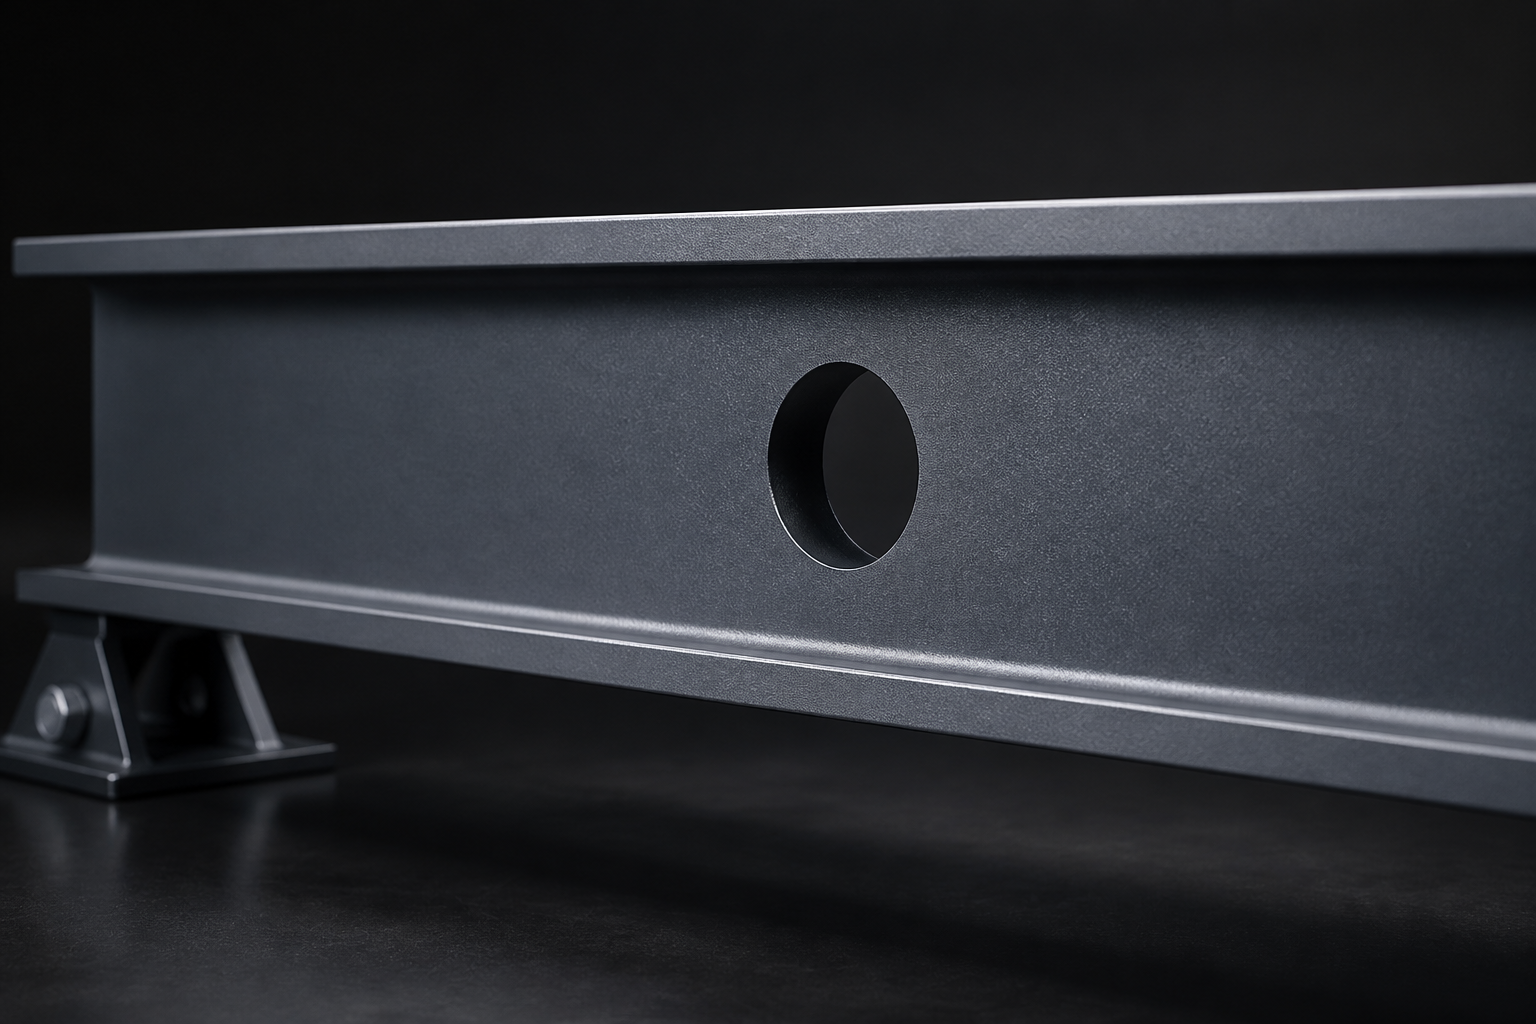
Apply installed S16 small-hole safe-harbour checks and CISC Part 5 isolated-opening calculations where supported.
Use engineer-specified or automatically sized reinforcement and weld design.
See the controlling face, location, and mechanism. Unsupported conditions are marked unavailable rather than approximated.
Model full-length symmetric flange cover plates with section properties updated automatically.
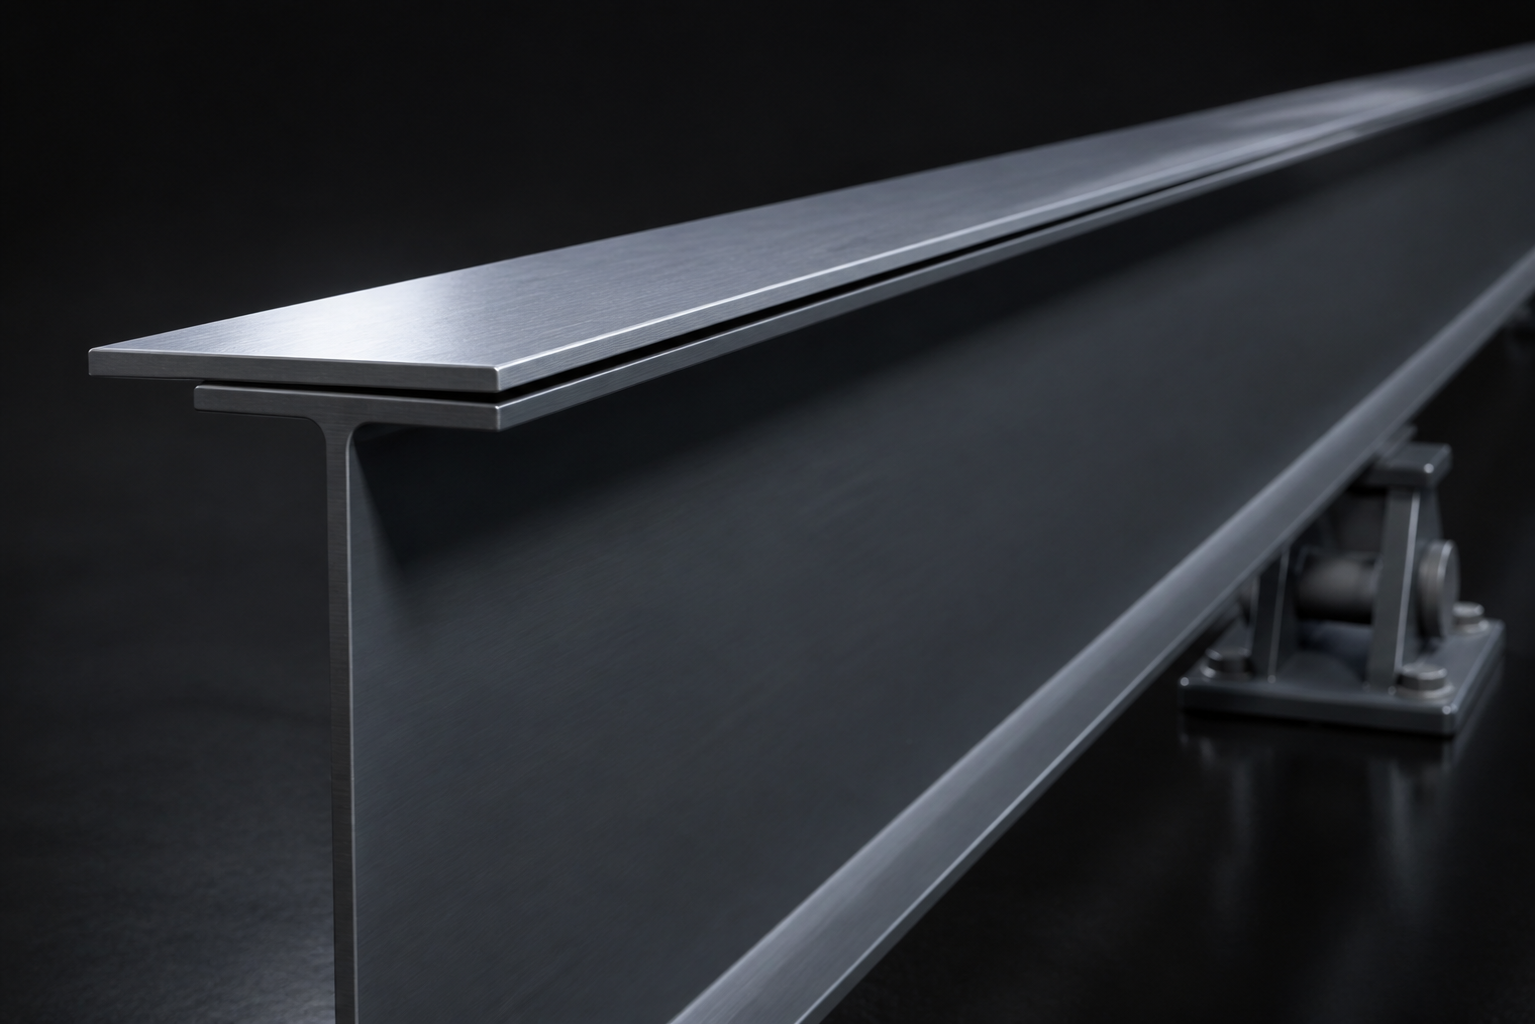
Calculate plate-to-flange shear flow and size the supported weld path automatically.
Split loads between existing and strengthened stages, with deflections combined correctly.
Verify a selected member or run an automatic search without losing track of which result you are reviewing.
Limit candidates by family, depth, weight, or office preferred and excluded lists.
Compare lightest, shallowest, and lowest-cost options side by side, not one unexplained answer.
See why each candidate was ruled out.
See PASS, FAIL, or unavailable. Unsupported checks are never presented as valid.
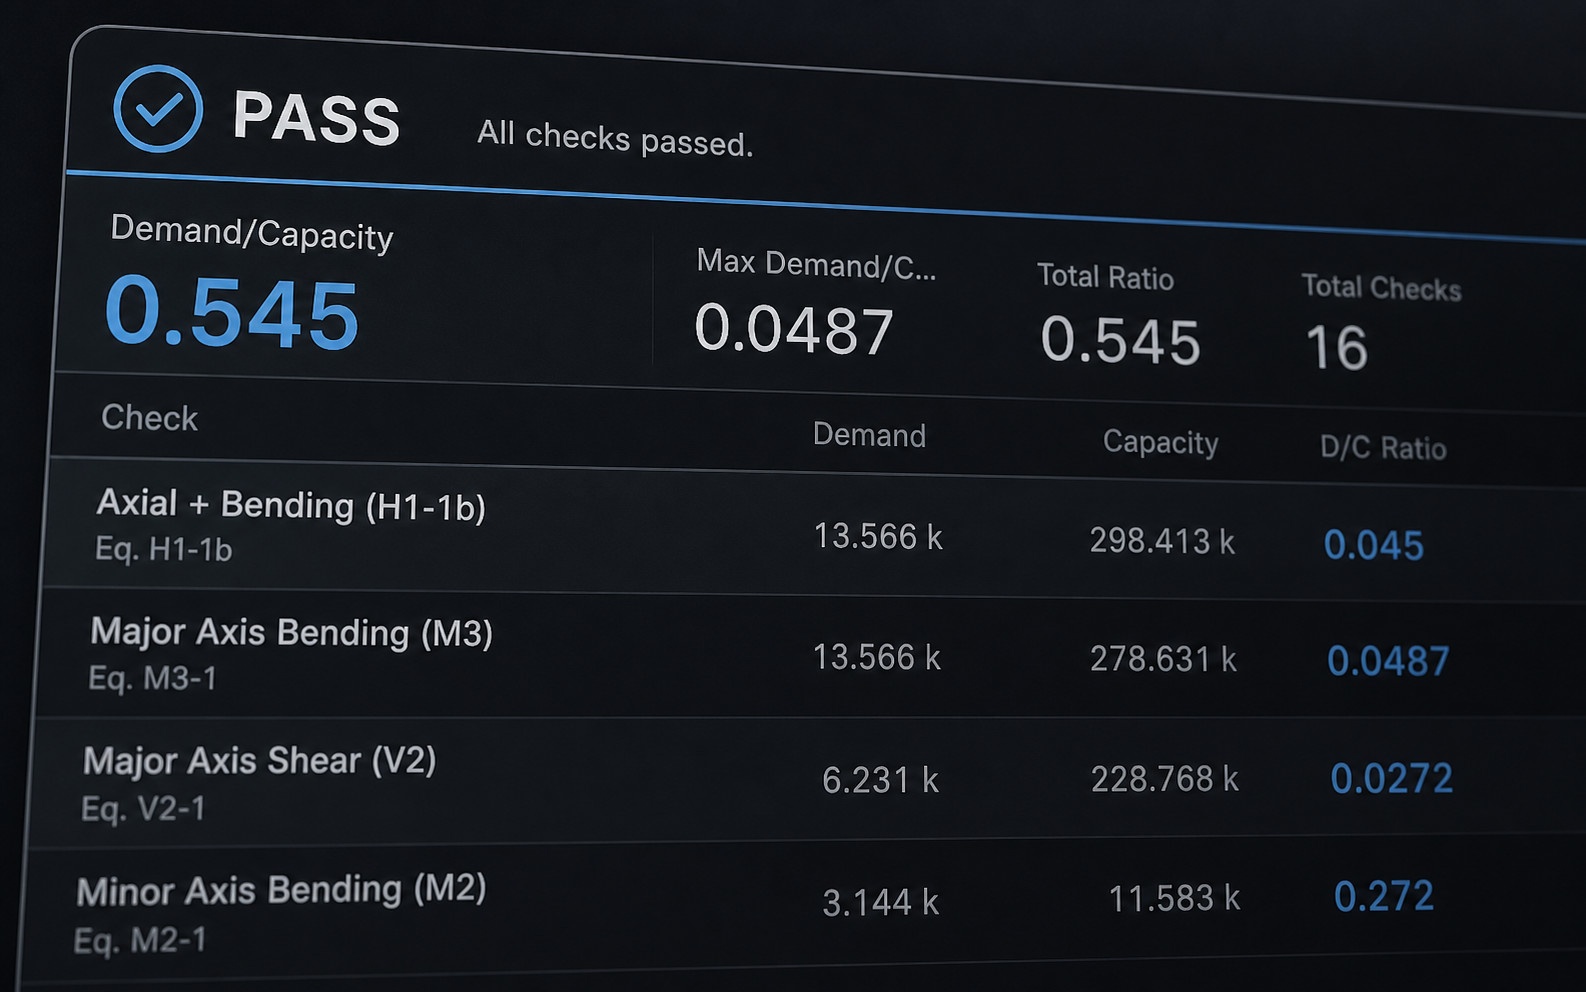
Read the actual demand, resistance, and governing ratio together, not just a percentage.
Jump from a governing result straight to the input that drives it.
Inspect the installed code path, assumptions, and data source behind the result.
Choose how much detail to include while keeping loads, checks, and results connected.
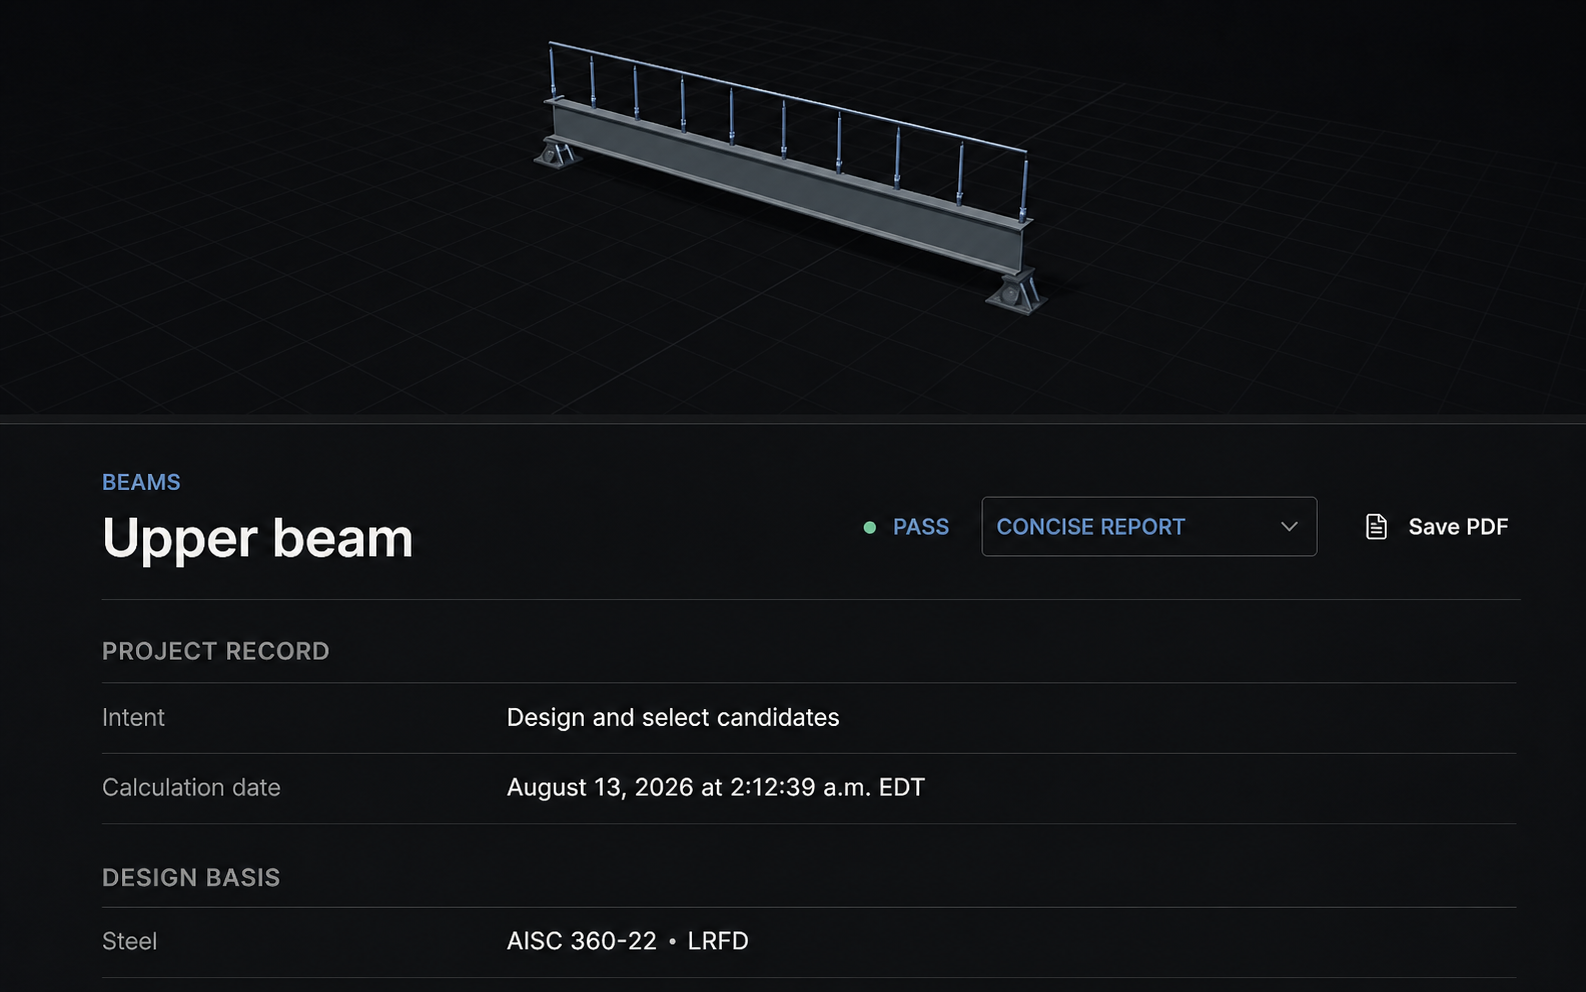
Export with project, client, and prepared-by or checked-by fields.
Include combinations, linked reactions, and section provenance automatically.
Pull up any past run exactly as it was calculated, with its engine fingerprint.
Create, rename, duplicate, archive, and search beams within a project.
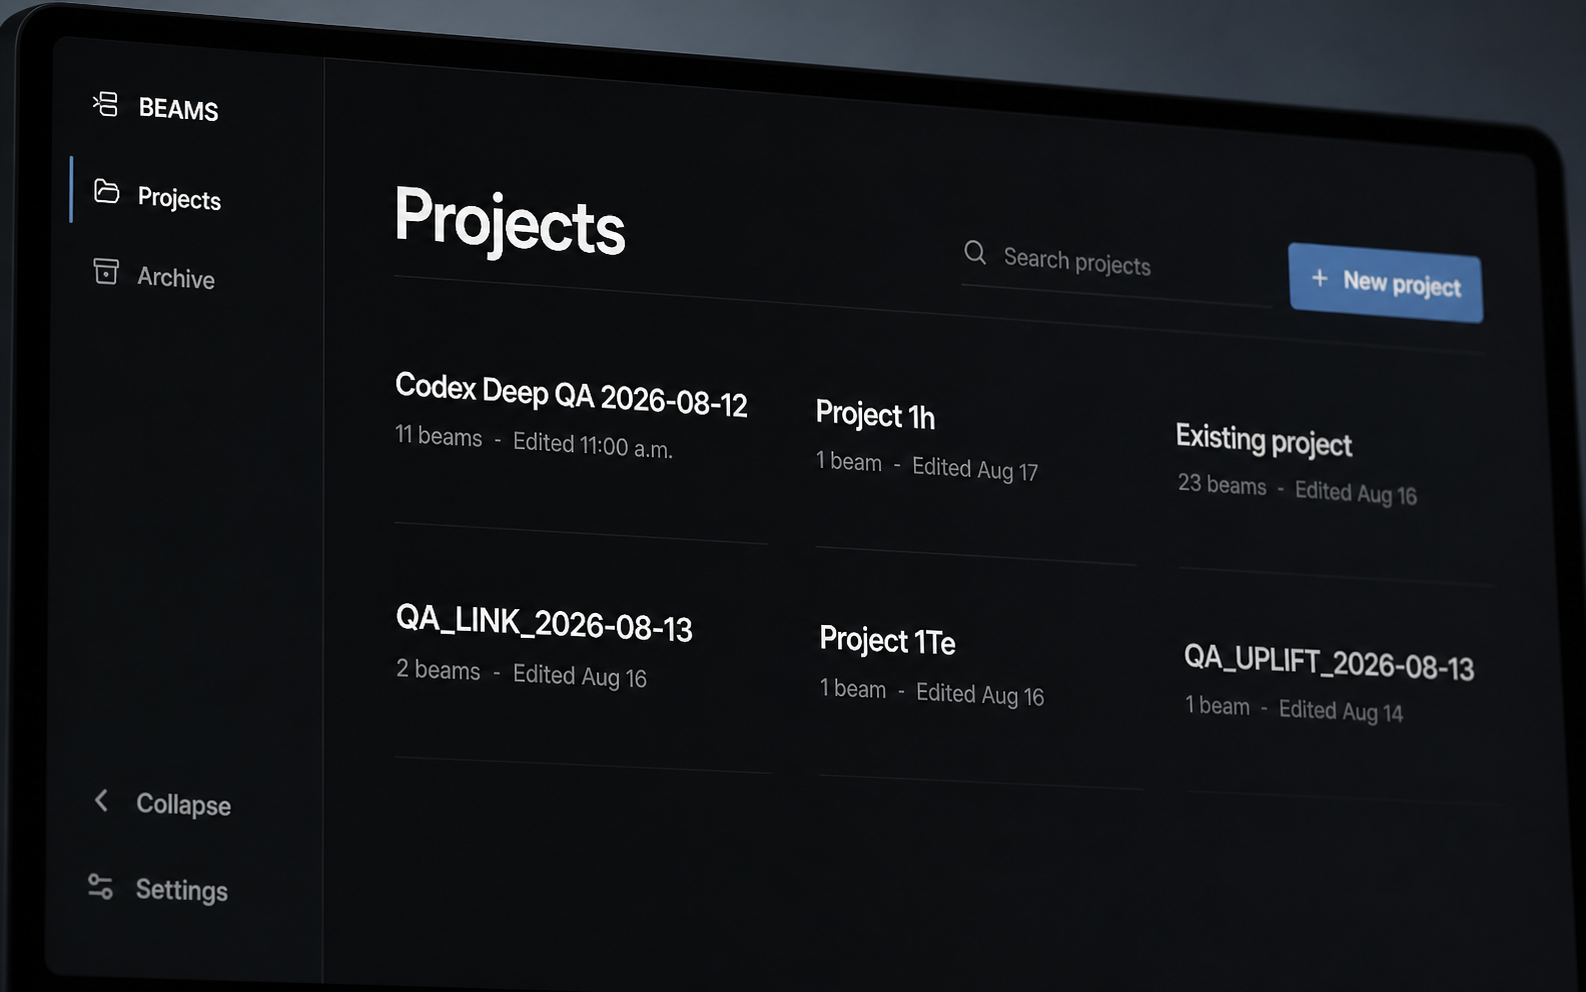
Save proven beam setups and version section, cost, and template policies across the office.
Restore your last session while preventing a stale editor from overwriting a newer revision.
Work in the drawing-native format while calculation values stay canonical.
See supports, loads, bracing, deck, studs, and openings together in 3D.
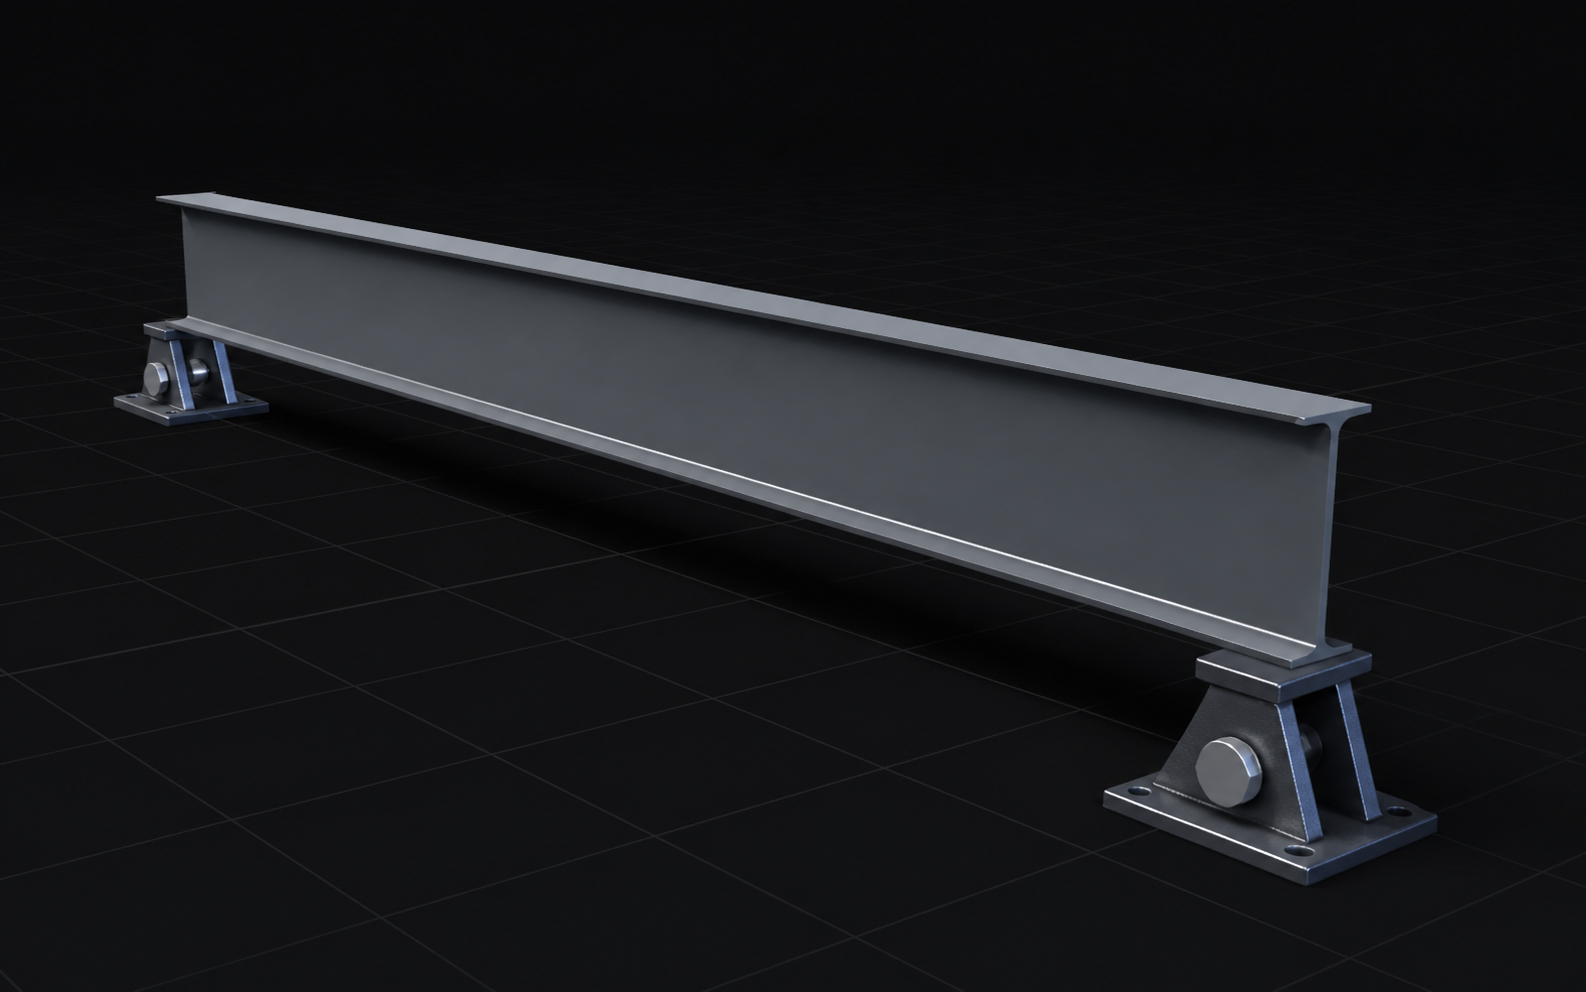
Keep your view between Member, Loads, Analysis, and Report.
Select a physical object and jump directly to the input that defines it.
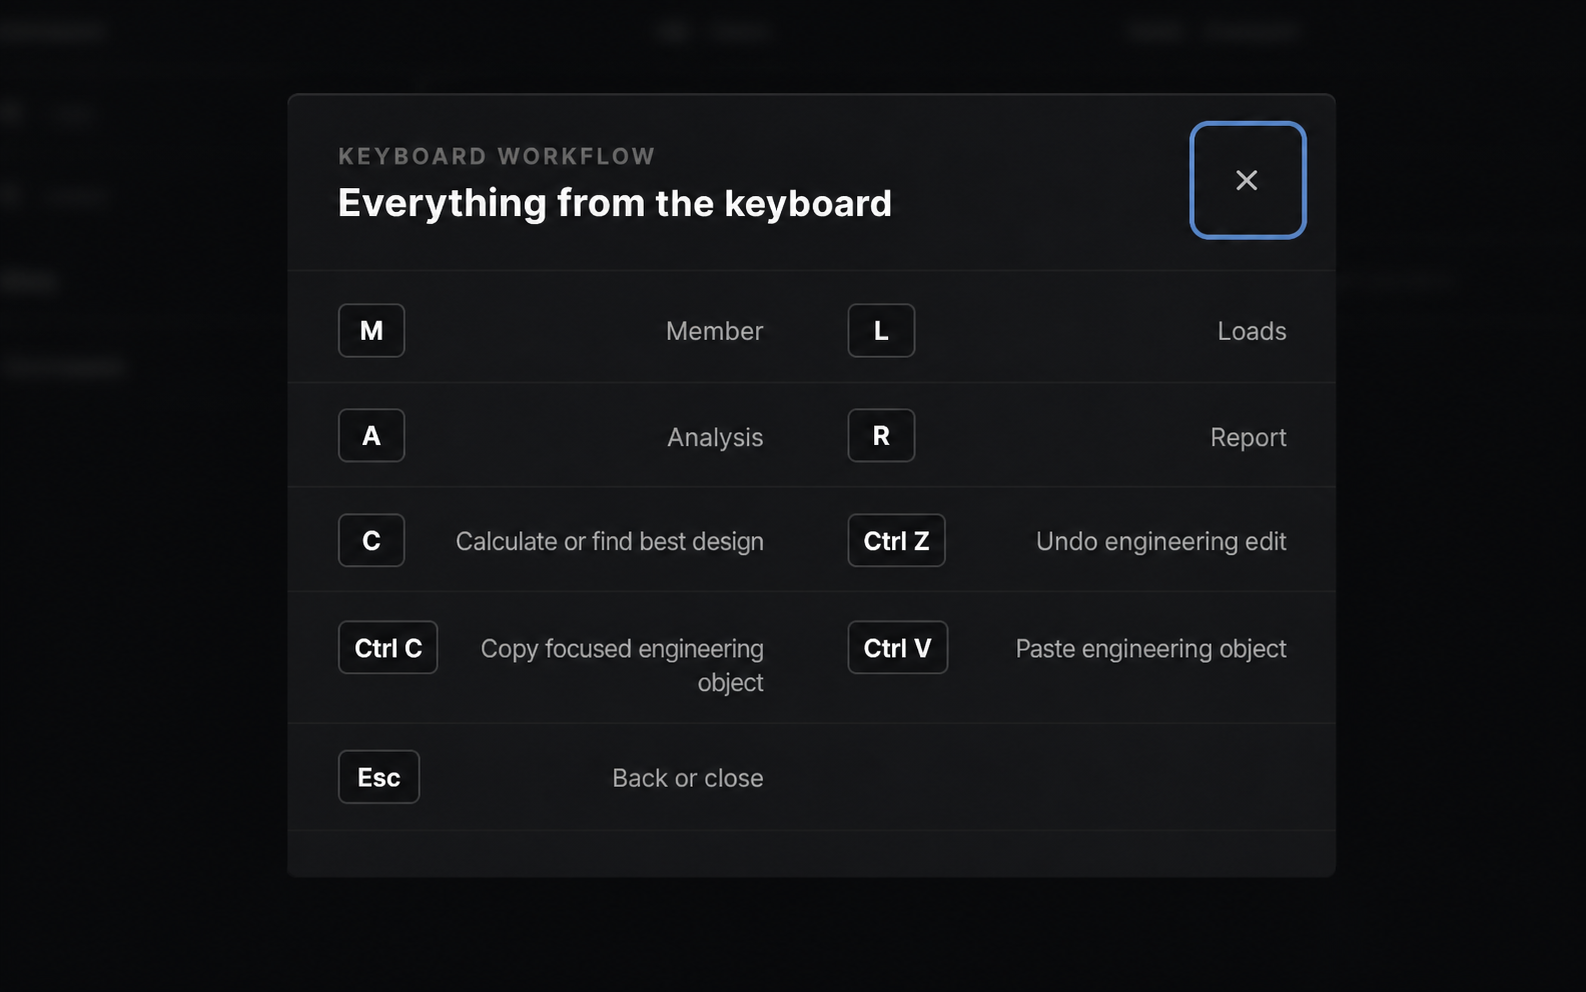
Move between workspaces and calculate without leaving the keyboard.
Reuse supports, bracing, and loads with safe station placement.
Keep routine beam checks fast even as the underlying model gets more complex.
Bring standards-compatible AI clients into authorized Beams tools instead of copying engineering data into a disconnected chat.
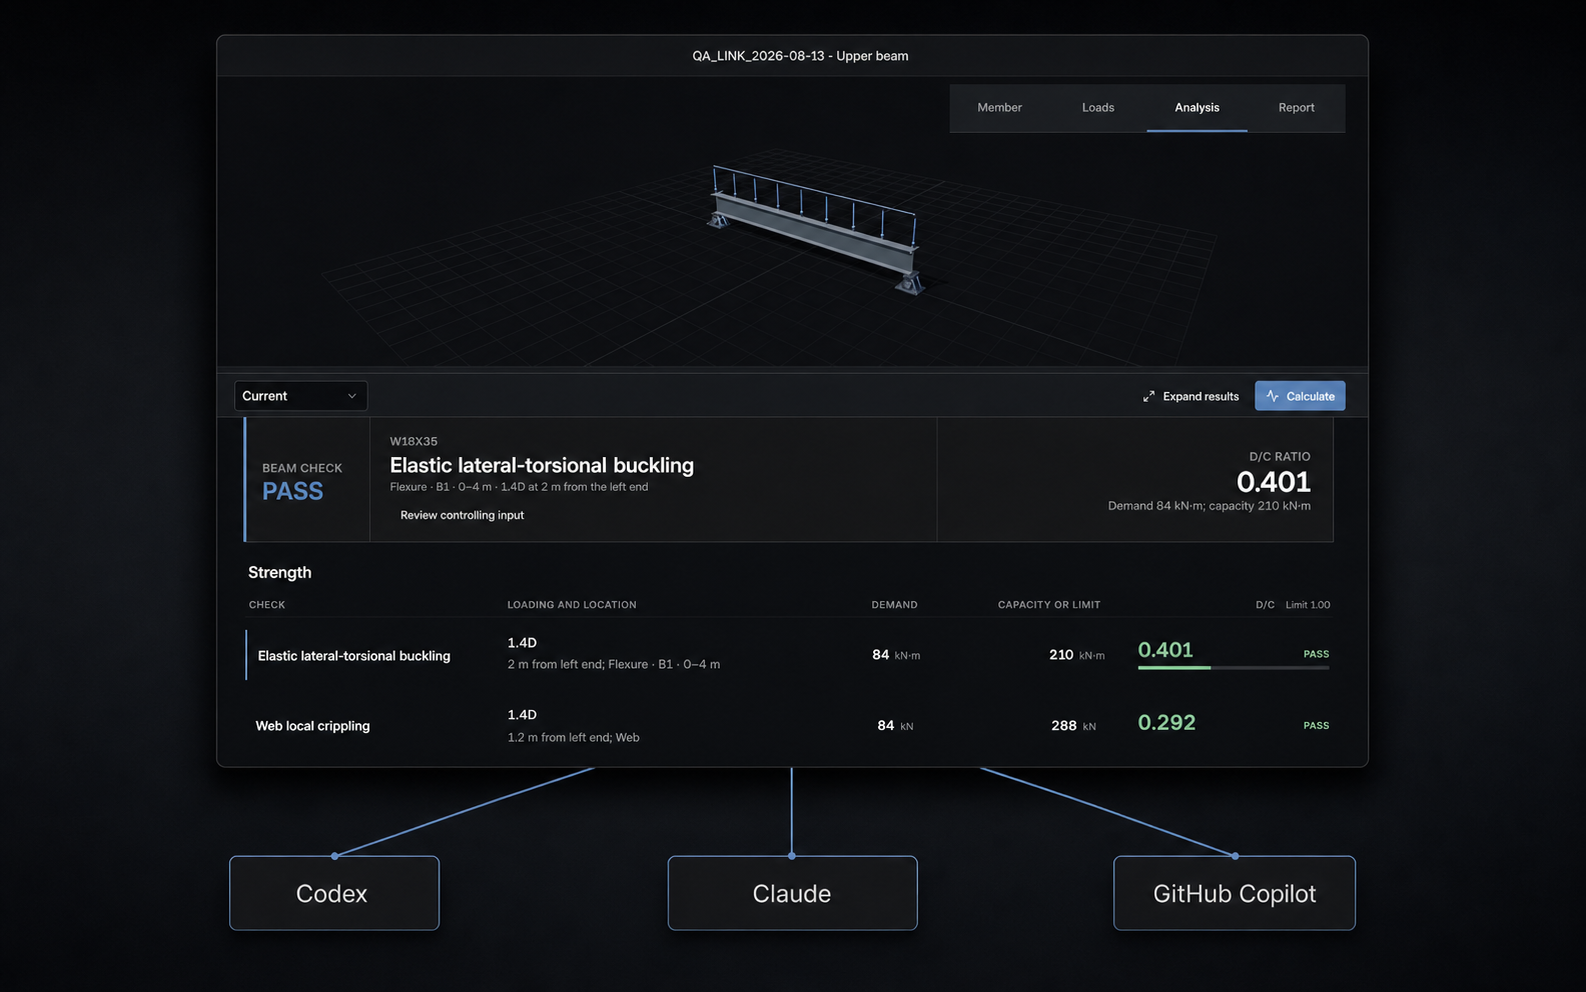
Authorized agents can list projects and search CISC and AISC section catalogues.
Let Codex, Claude, or GitHub Copilot update beam inputs while every result still runs through the deterministic Beams engine.
Generate printable reports and retrieve authorized resources tied to the calculation record.
Use OAuth scopes, tenant isolation, role enforcement, and audit logs.